


종합적 분석을 이용한 트레이스 차이 분석#
저자: Anupam Bhatnagar 번역: 이진혁 <https://github.com/uddk6215>__
때때로 사용자들은 코드 변경으로 인한 PyTorch 연산자와 CUDA 커널의 변화를 식별해야 할 필요가 있습니다. 이를 위해 HTA는 트레이스 비교 기능을 제공합니다. 이 기능을 통해 사용자는 두 세트의 트레이스 파일을 입력할 수 있는데, A/B 테스트와 유사하게, 첫 번째 세트는 대조군으로, 두 번째 세트는 실험군으로 간주할 수 있습니다. TraceDiff 클래스는 트레이스 간의 차이를 비교하고 이러한 차이를 시각화하는 기능을 제공합니다. 특히, 사용자는 각 그룹에서 추가되거나 제거된 연산자와 커널을 찾을 수 있으며, 각 연산자/커널의 빈도와 누적 소요 시간도 확인할 수 있습니다.
TraceDiff 클래스는 다음과 같은 메소드를 가지고 있습니다. TraceDiff 클래스의 메소드:
compare_traces: 두 세트의 트레이스에서 CPU 연산자와 GPU 커널의 빈도와 총 지속 시간을 비교합니다.
ops_diff: 다음과 같은 상태의 연산자와 커널을 가져옵니다. 상태 예시:
추가: 실험군의 트레이스에는 추가되었고 대조군의 트레이스에는 없는 것
삭제: 실험군의 트레이스에서 삭제되고 대조군의 트레이스에는 있는 것
증가: 실험군의 트레이스에서 빈도가 증가하고 대조군의 트레이스에도 존재하는 것
감소: 실험군의 트레이스에서 빈도가 감소하고 대조군의 트레이스에도 존재하는 것
변경 안 됨: 두 세트의 트레이스 간에 변화가 없는 것
마지막 두 메소드는 compare_traces 메소드의 출력을 사용하여 CPU 연산자와 GPU 커널의 빈도 및 지속 시간의 다양한 변화를 시각화하는 데 사용할 수 있습니다.
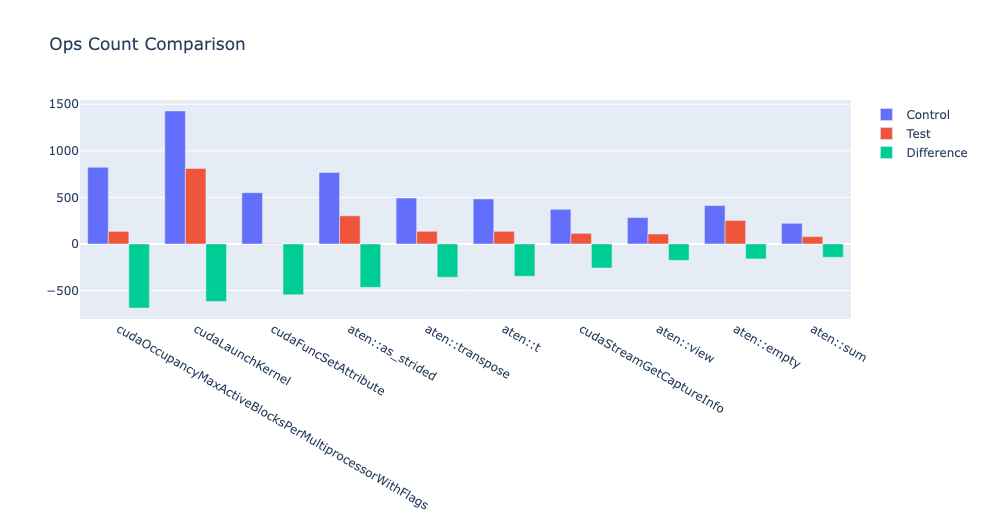
예를 들어, 빈도가 증가한 상위 10개의 연산자는 다음과 같이 계산할 수 있습니다.
df = compare_traces_output.sort_values(by="diff_counts", ascending=False).head(10)
TraceDiff.visualize_counts_diff(df)
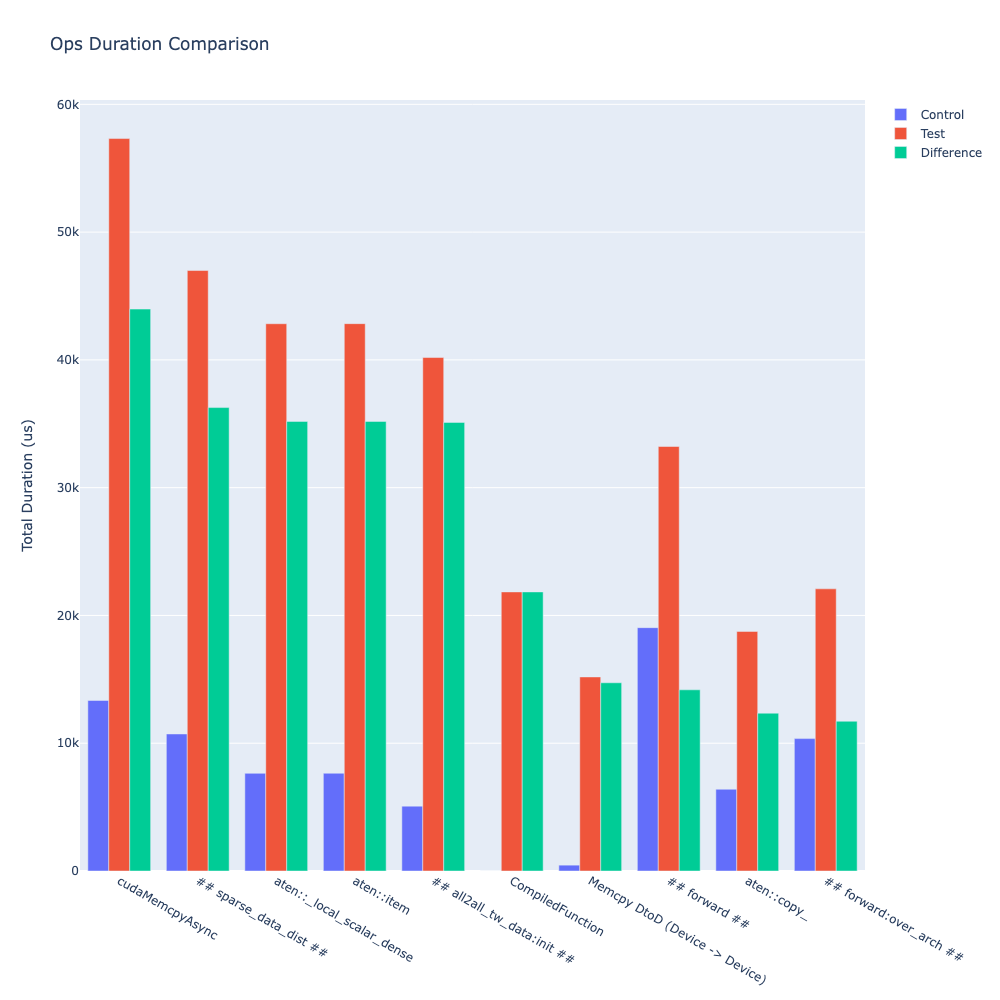
마찬가지로, 지속 시간 변화가 가장 큰 상위 10개 연산자는 다음과 같이 계산할 수 있습니다.
df = compare_traces_output.sort_values(by="diff_duration", ascending=False)
# "ProfilerStep"에 의해 지속 시간 차이가 가려질 수 있으므로,
# 이를 필터링하여 다른 연산자들의 경향을 보여줄 수 있습니다.
df = df.loc[~df.index.str.startswith("ProfilerStep")].head(10)
TraceDiff.visualize_duration_diff(df)
이 기능에 대한 자세한 예시는 저장소의 examples 폴더에 있는 trace_diff_demo notebook 을 보면 됩니다.
